

Integrated Quote
Revenue-critical flow under behavioral friction

Insurance quoting is not simply a form experience—it is a multi-step transaction system shaped by eligibility, identity, pricing, and regulatory constraints. The challenge was reducing abandonment without oversimplifying the underlying logic. By restructuring the flow around progressive decisions and earlier pricing clarity, the experience became faster, more understandable, and more resilient under real-world use.
High-frequency payment workflows redesigned for faster comprehension, clearer hierarchy, and reduced transactional friction.
System-Level Decision Design
Translating complexity into coordinated execution
The work required aligning UX, business rules, engineering dependencies, and operational constraints across multiple teams. I helped shape the flow architecture around identity resolution, eligibility validation, pricing updates, and bind readiness—ensuring the system responded consistently as user inputs changed. The focus was not only interface clarity, but reducing downstream operational risk through better validation and guided interaction.
The quote flow behaved as a live system—resolving risk, pricing, and validation dynamically as users progressed.
Payment Center
Reducing operational friction in a high-frequency workflow
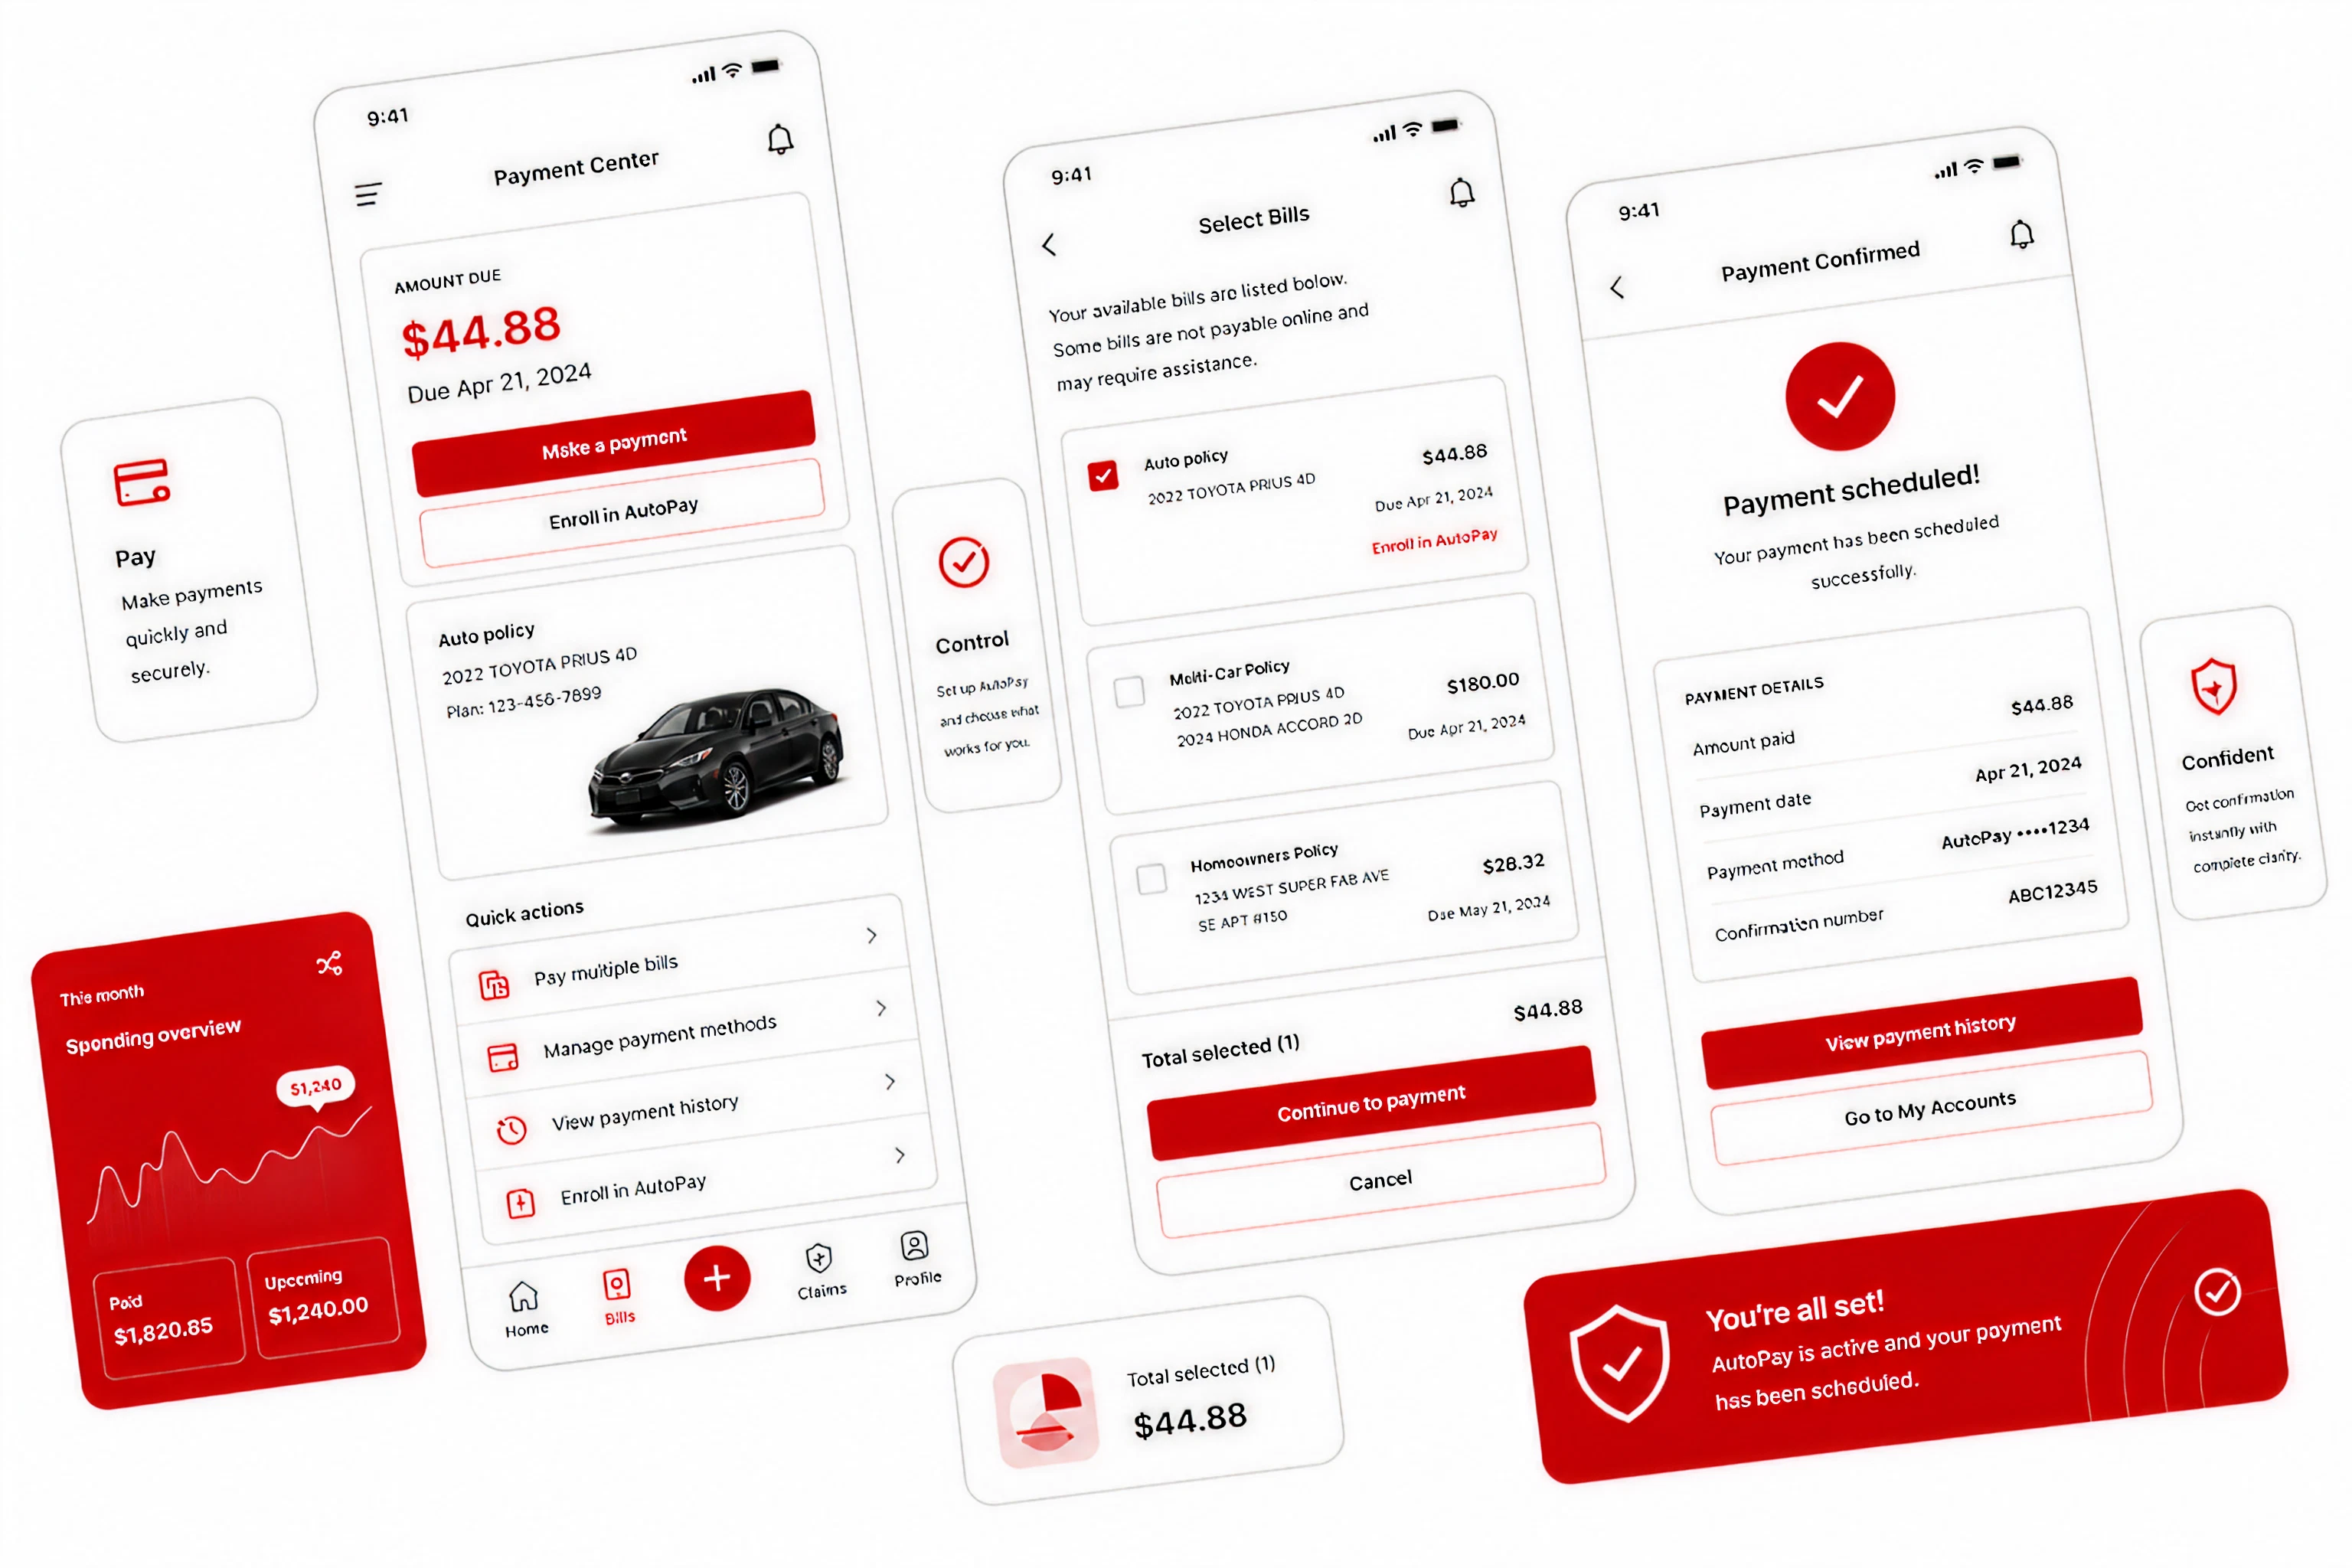
The Payment Center served as one of the highest-traffic authenticated experiences in the platform. Users needed immediate visibility into balances, policies, due dates, and available actions without navigating unnecessary complexity. The redesign prioritized glanceable hierarchy, faster comprehension, and clearer transactional pathways across responsive breakpoints. Validation, account context, and payment actions were surfaced progressively to reduce backtracking and improve confidence before submission. The experience balanced enterprise-scale operational requirements with a simpler, more consumer-oriented interaction model.
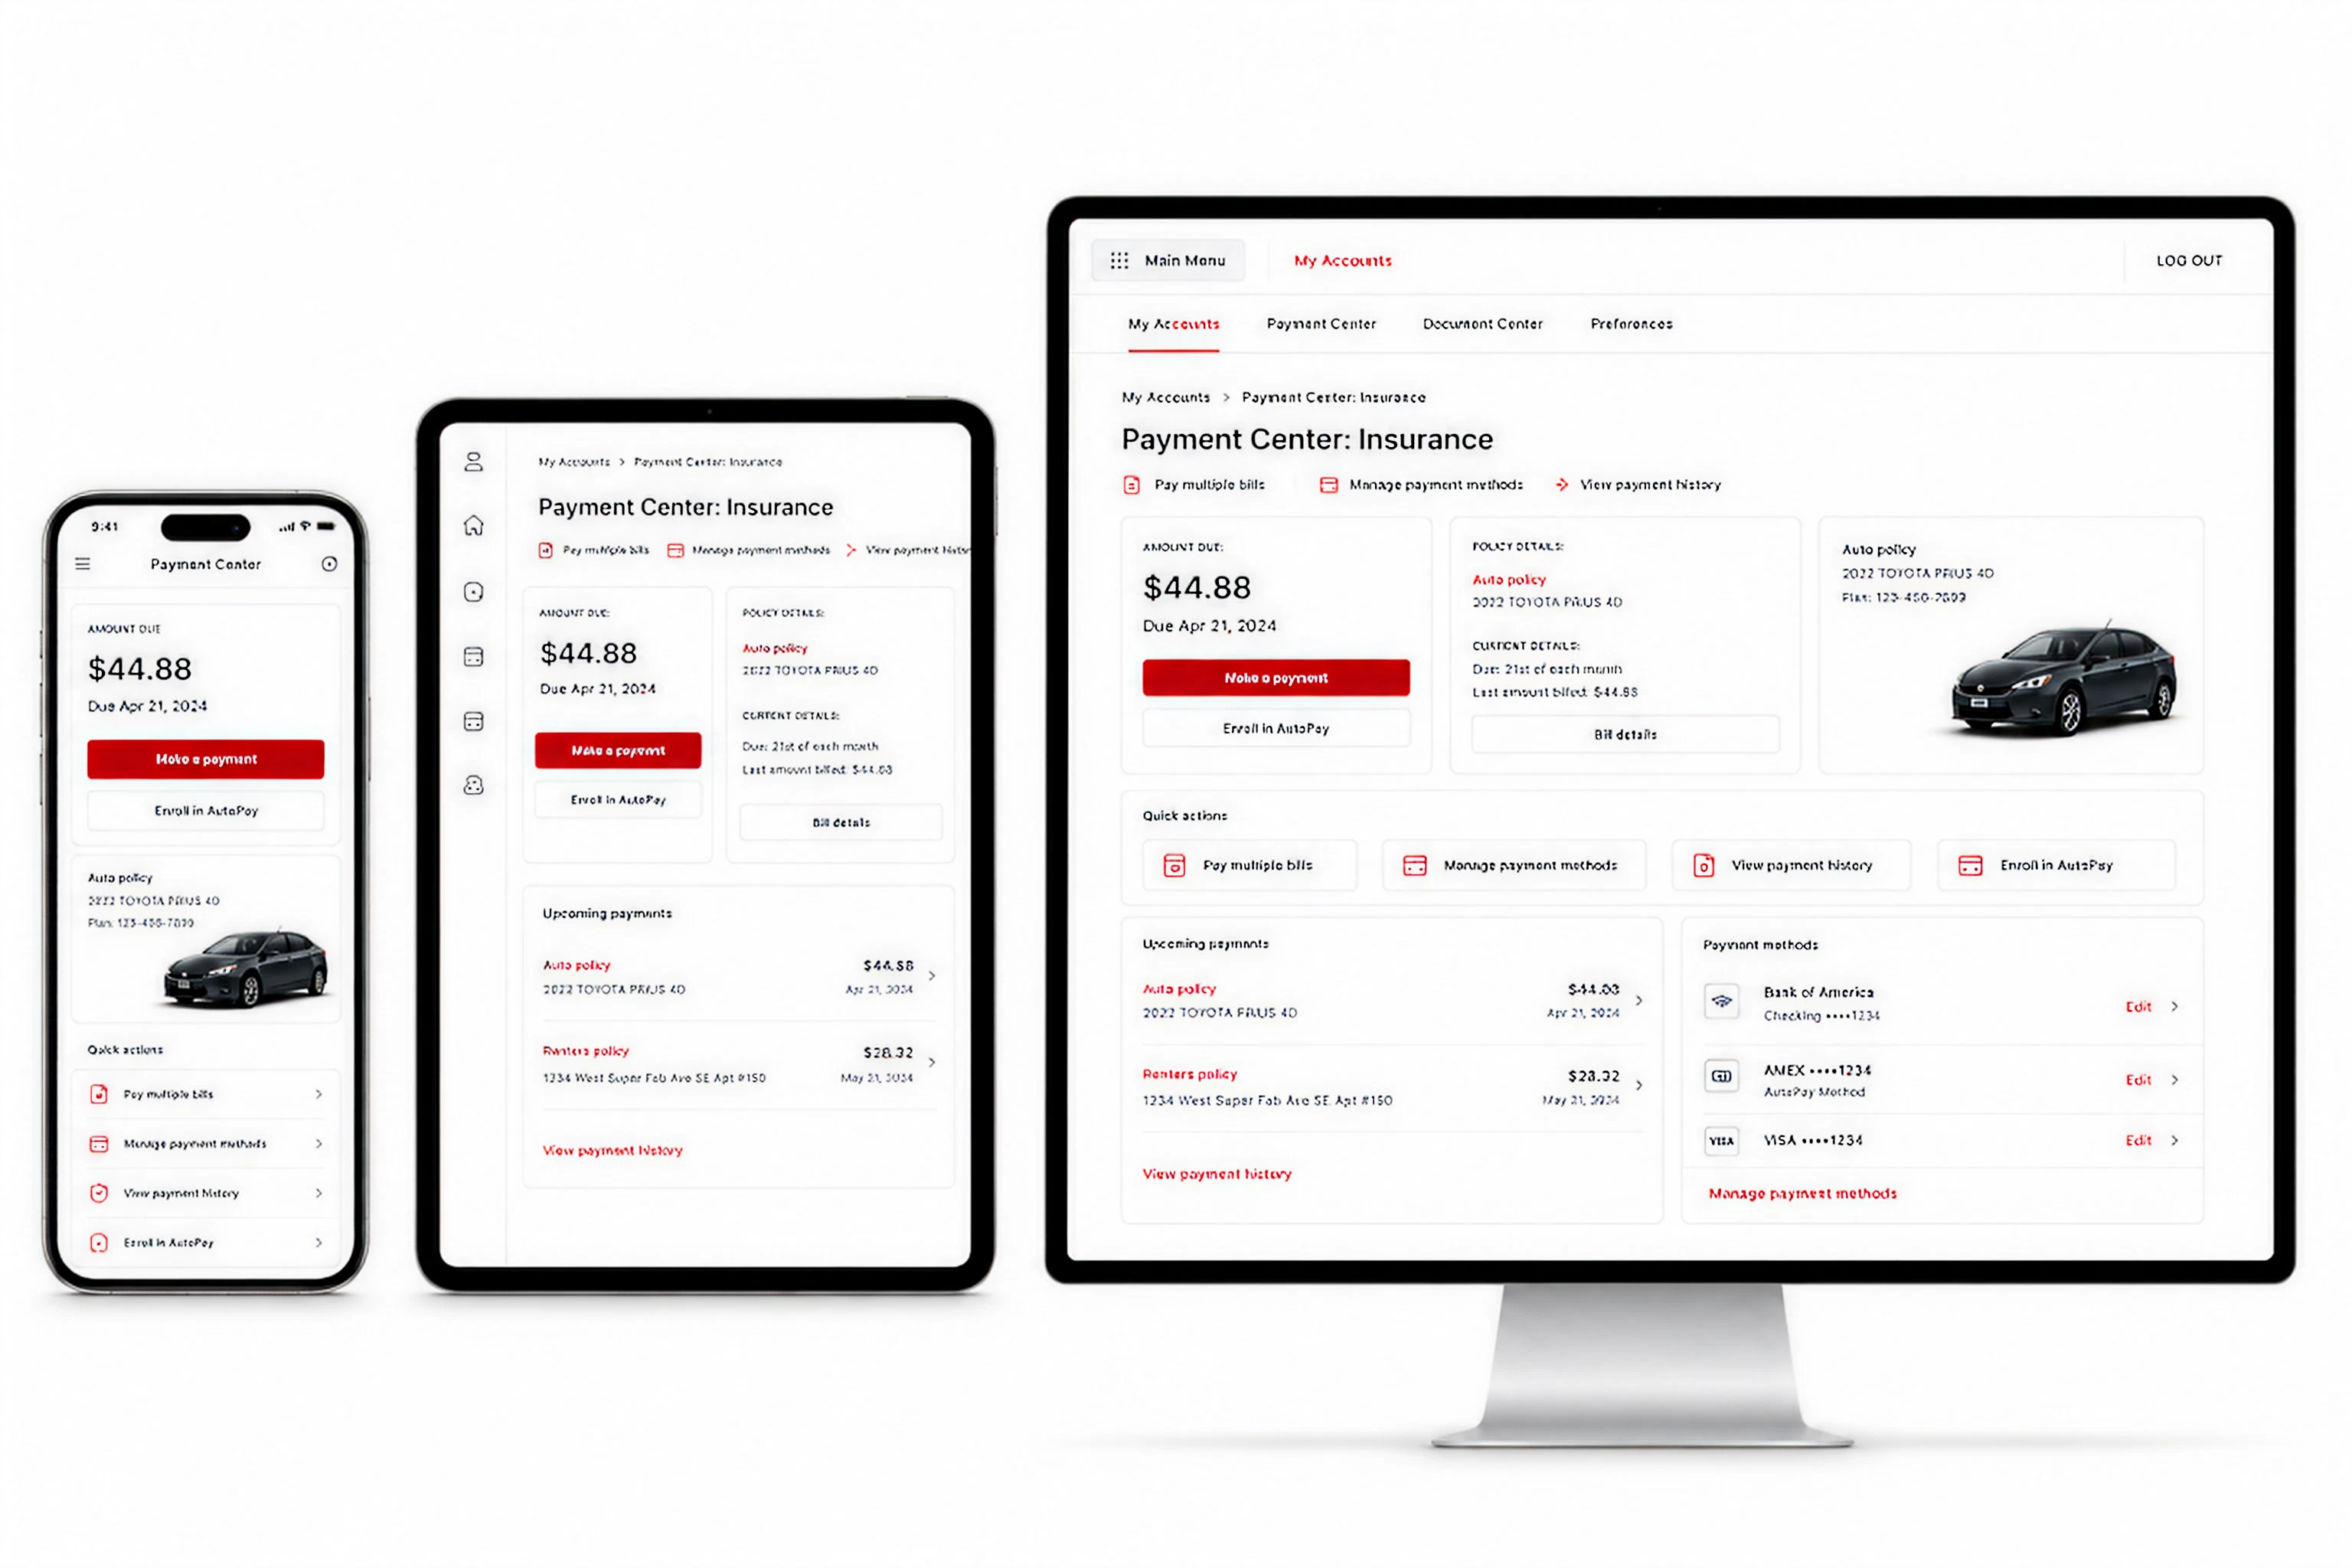
High-frequency payment workflows redesigned for faster comprehension, clearer hierarchy, and reduced transactional friction.
Select Bills
Clarifying multi-policy payment decisions across devices
Users managing multiple policies often struggled to understand which balances were due, how payments were grouped, and what actions were required next. The redesigned bill-selection flow simplified comparison and prioritization through structured grouping, progressive totals, and clearer status visibility. Responsive layouts ensured consistency across mobile, tablet, and desktop environments while maintaining transactional confidence. The flow emphasized transparency and decision clarity—helping users understand what they were paying, why it mattered, and how their selections impacted the final transaction before submission.
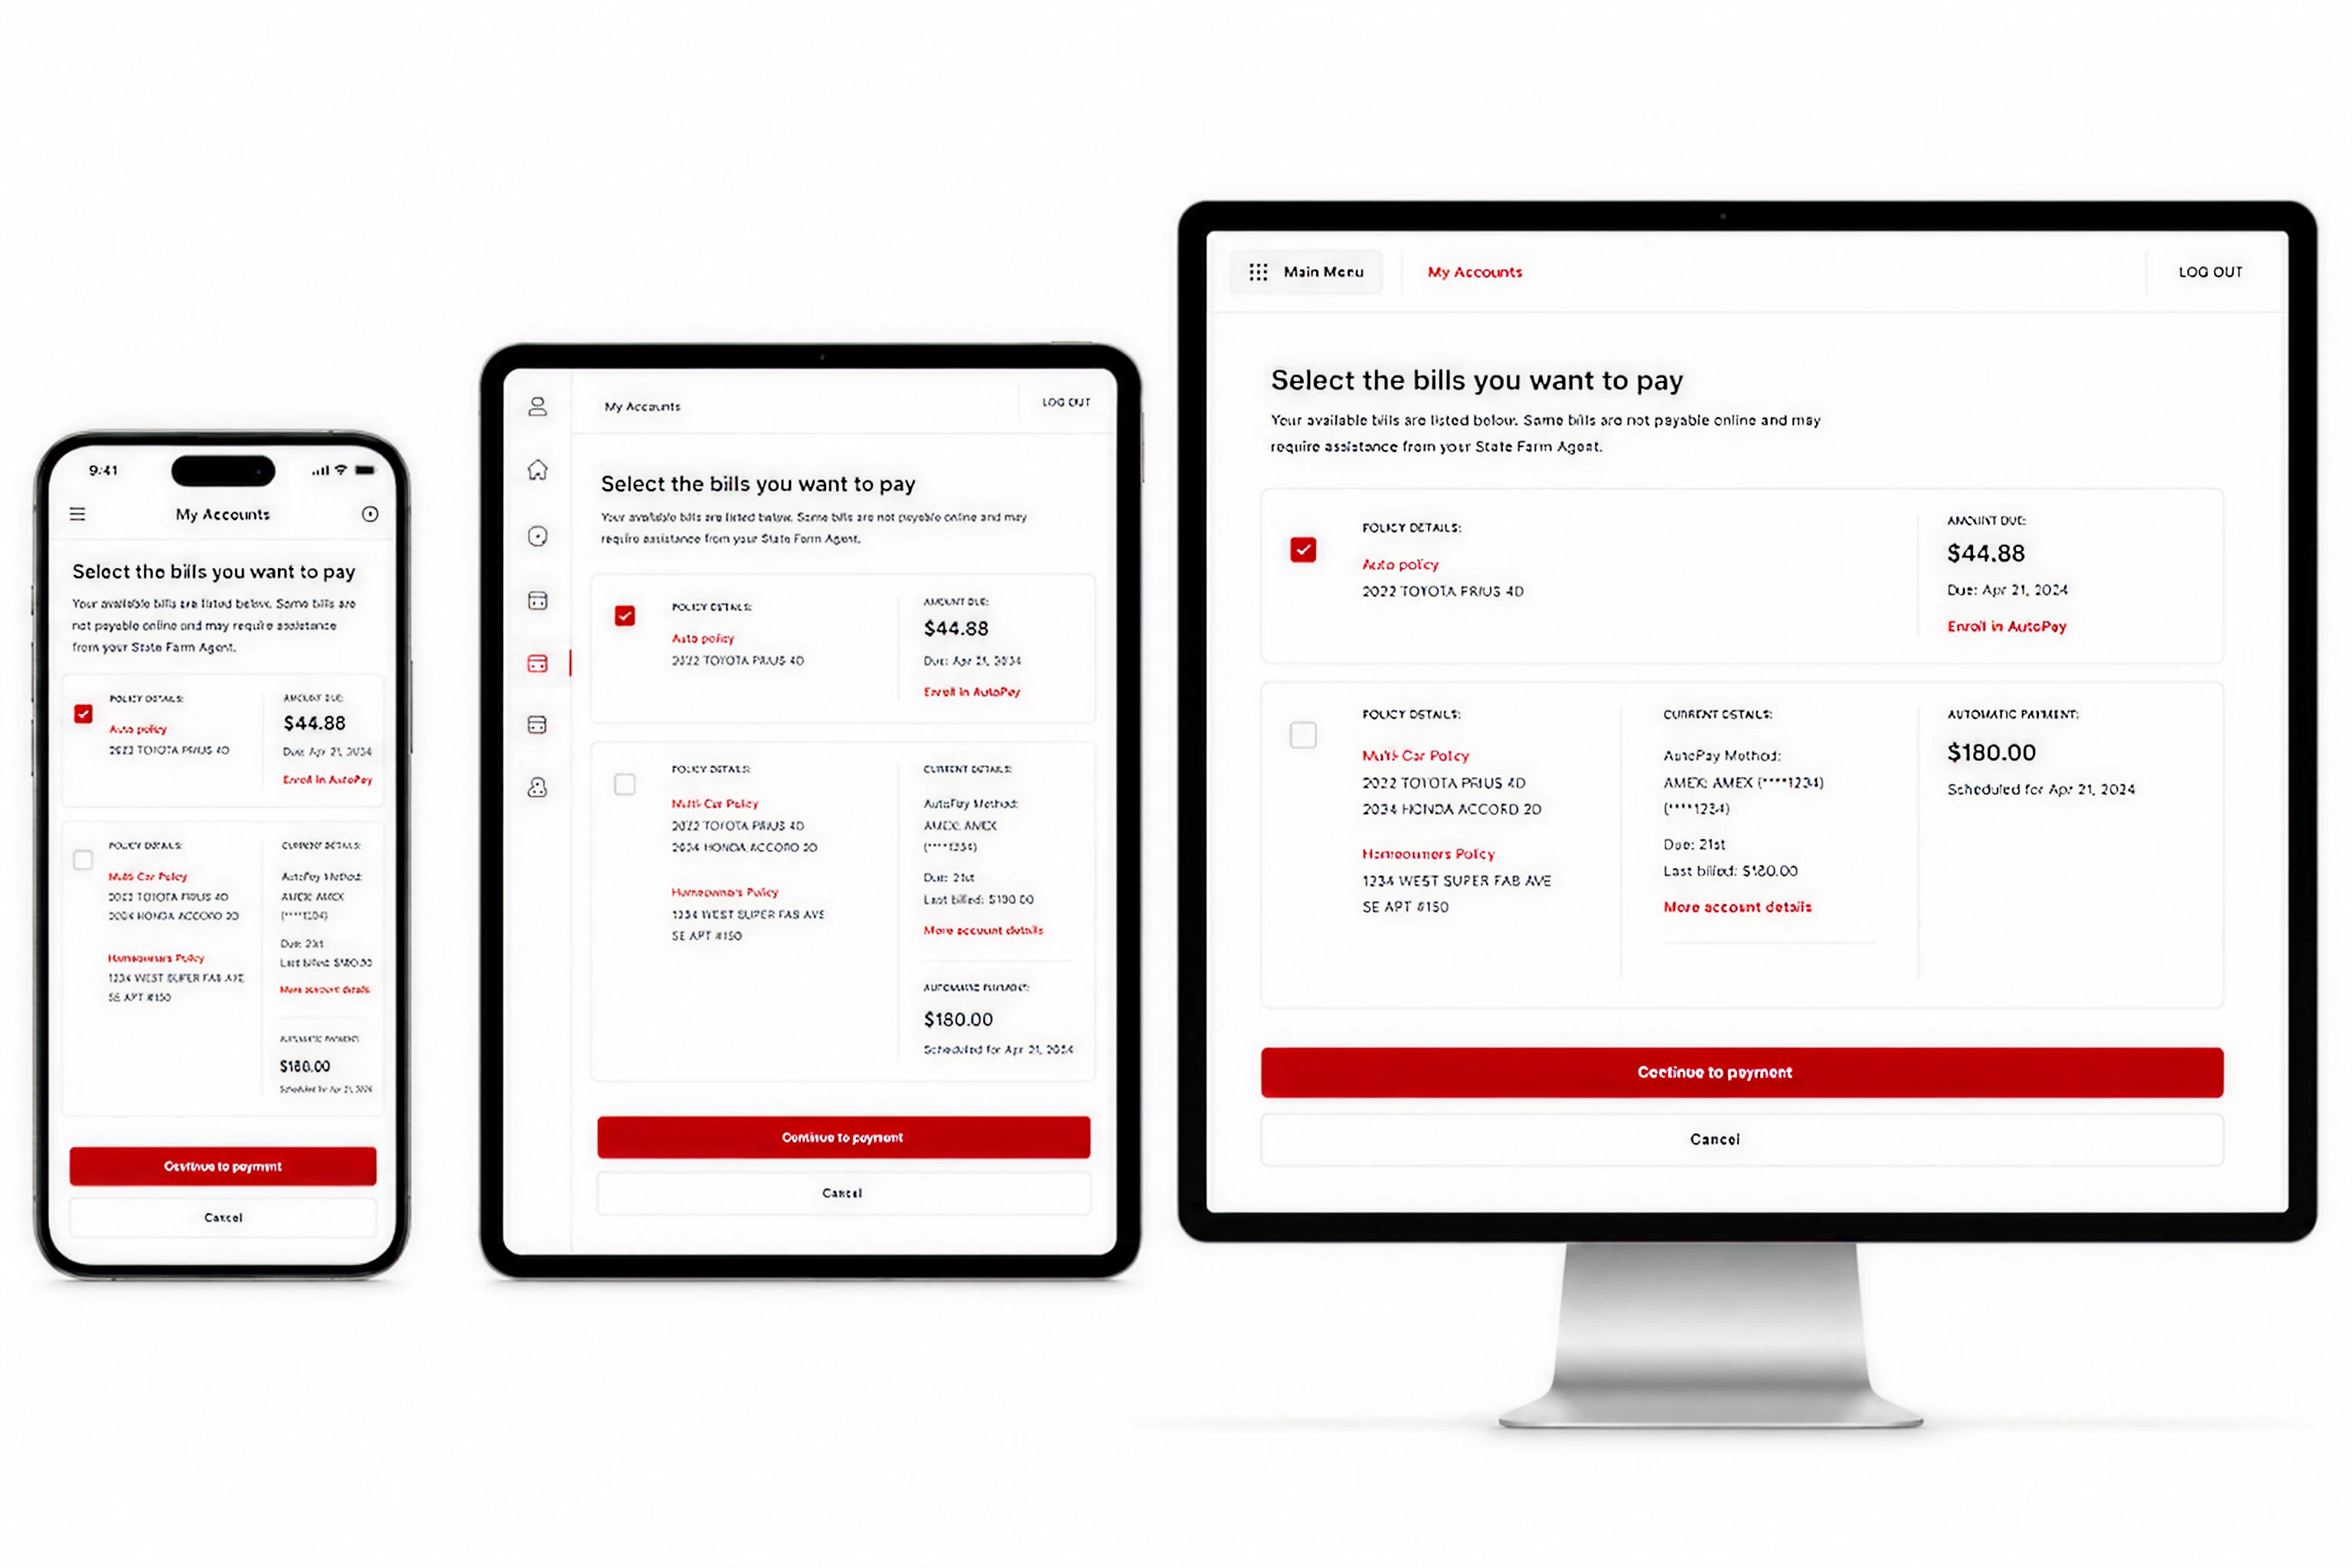
Structured bill selection reduced ambiguity and improved decision confidence before payment submission.
Metrics & Impact
Measured improvements across clarity, completion, and operational efficiency
Measured improvements across clarity, completion, and operational efficiency
The redesign improved how users progressed through quoting while reducing invalid submissions and unnecessary backtracking. The experience balanced transactional speed with system reliability, helping users move from intent to bind with greater confidence.
🌟 Quote completion clarity ↑ 34%
⏱ Time-to-bind ↓ 29%
📉 Invalid submission errors ↓ 41%
📈 User continuation across quote stages ↑ 26%
© 2026 Stanford Ashcraft. Portfolio work shown for illustrative purposes.
Confirmation
Confirmation & Resolution
Confirmation screens are often treated as endpoints, but in transactional systems they also function as reassurance, validation, and operational continuity. The redesigned confirmation experience clarified payment status, account updates, confirmation references, and next-best-actions immediately after submission. The system emphasized trust and resolution—ensuring users understood what had changed, what was completed successfully, and what actions remained available. This reduced uncertainty after payment while reinforcing consistency across the broader billing ecosystem.
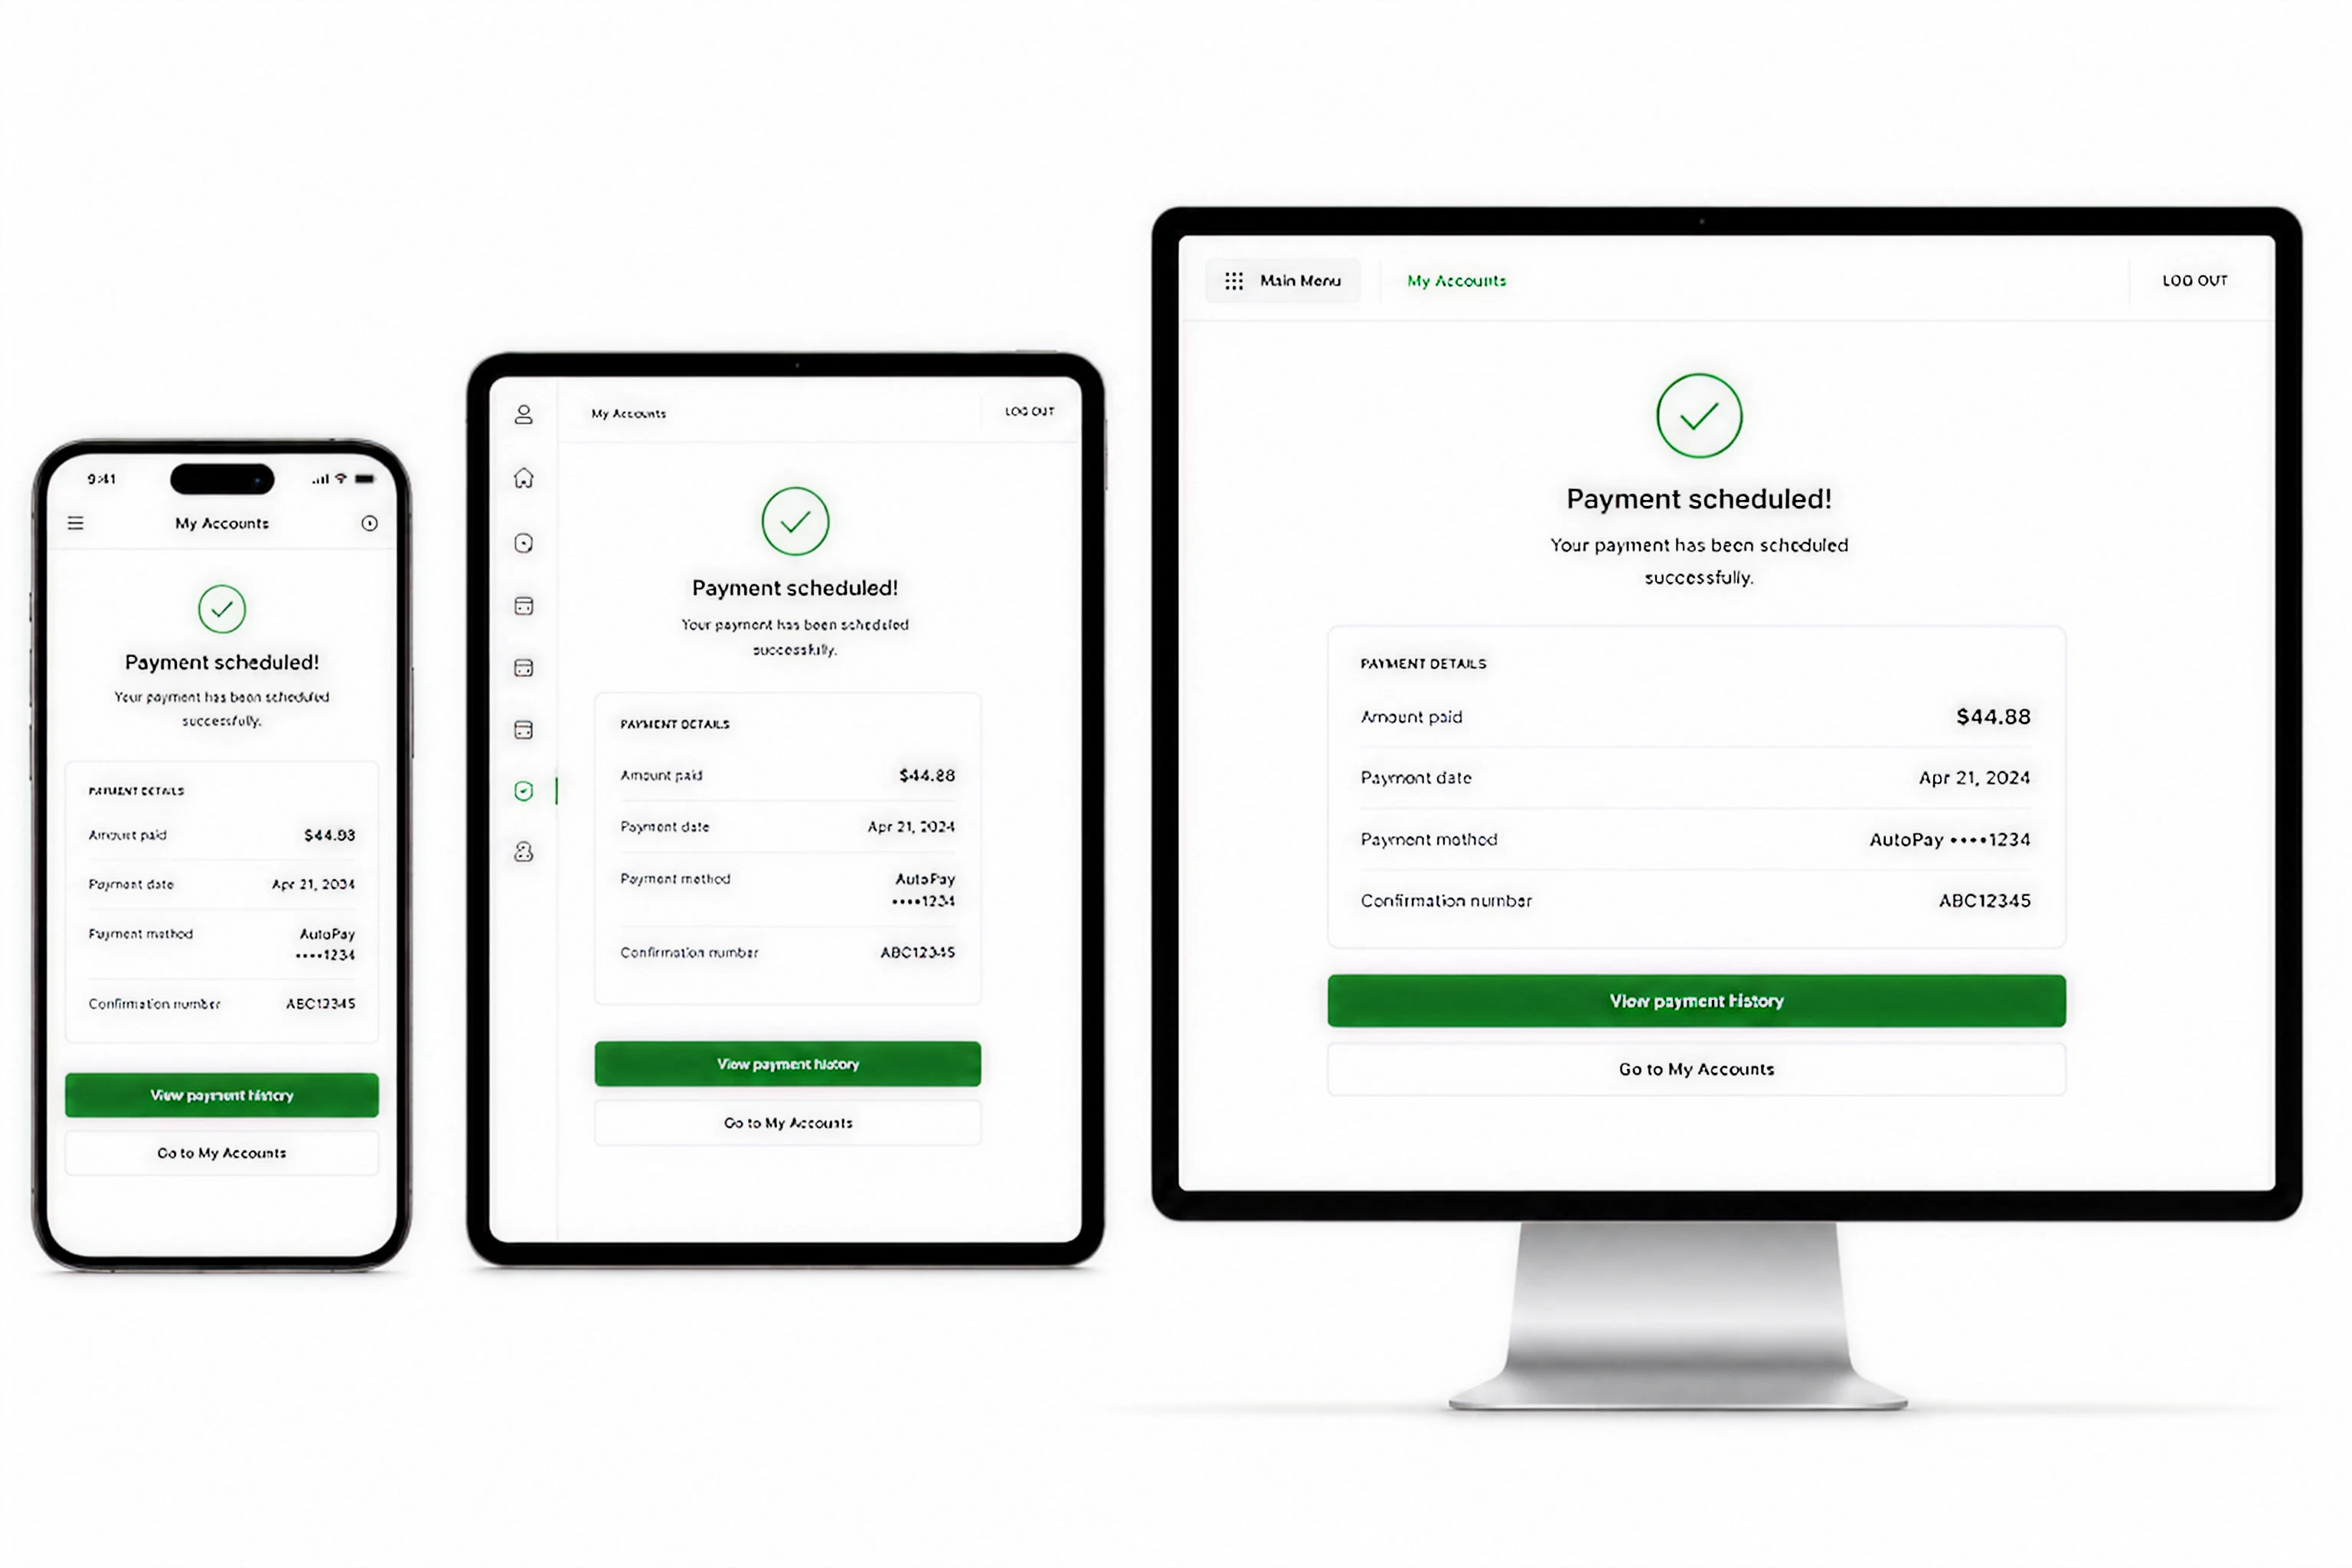
Confirmation became more than a receipt—it reinforced trust, completion, and next-step clarity after transaction submission.
Stanford Ashcraft
DESIGN SYSTEMS
DESIGN SYSTEMS
Integrated Quote
Revenue-critical flow under behavioral friction
Insurance quoting is not simply a form experience—it is a multi-step transaction system shaped by eligibility, identity, pricing, and regulatory constraints. The challenge was reducing abandonment without oversimplifying the underlying logic. By restructuring the flow around progressive decisions and earlier pricing clarity, the experience became faster, more understandable, and more resilient under real-world use.
High-frequency payment workflows redesigned for faster comprehension, clearer hierarchy, and reduced transactional friction.
System-Level Decision Design
Translating complexity into coordinated execution
The work required aligning UX, business rules, engineering dependencies, and operational constraints across multiple teams. I helped shape the flow architecture around identity resolution, eligibility validation, pricing updates, and bind readiness—ensuring the system responded consistently as user inputs changed. The focus was not only interface clarity, but reducing downstream operational risk through better validation and guided interaction.
The quote flow behaved as a live system—resolving risk, pricing, and validation dynamically as users progressed.
Payment Center
Reducing operational friction in a high-frequency workflow
The Payment Center served as one of the highest-traffic authenticated experiences in the platform. Users needed immediate visibility into balances, policies, due dates, and available actions without navigating unnecessary complexity. The redesign prioritized glanceable hierarchy, faster comprehension, and clearer transactional pathways across responsive breakpoints. Validation, account context, and payment actions were surfaced progressively to reduce backtracking and improve confidence before submission. The experience balanced enterprise-scale operational requirements with a simpler, more consumer-oriented interaction model.
High-frequency payment workflows redesigned for faster comprehension, clearer hierarchy, and reduced transactional friction.
Select Bills
Clarifying multi-policy payment decisions across devices
Users managing multiple policies often struggled to understand which balances were due, how payments were grouped, and what actions were required next. The redesigned bill-selection flow simplified comparison and prioritization through structured grouping, progressive totals, and clearer status visibility. Responsive layouts ensured consistency across mobile, tablet, and desktop environments while maintaining transactional confidence. The flow emphasized transparency and decision clarity—helping users understand what they were paying, why it mattered, and how their selections impacted the final transaction before submission.
Structured bill selection reduced ambiguity and improved decision confidence before payment submission.
Confirmation
Confirmation & Resolution
Confirmation screens are often treated as endpoints, but in transactional systems they also function as reassurance, validation, and operational continuity. The redesigned confirmation experience clarified payment status, account updates, confirmation references, and next-best-actions immediately after submission. The system emphasized trust and resolution—ensuring users understood what had changed, what was completed successfully, and what actions remained available. This reduced uncertainty after payment while reinforcing consistency across the broader billing ecosystem.
Confirmation became more than a receipt—it reinforced trust, completion, and next-step clarity after transaction submission.
Metrics & Impact
Measured improvements across clarity, completion, and operational efficiency
Measured improvements across clarity, completion, and operational efficiency
The redesign improved how users progressed through quoting while reducing invalid submissions and unnecessary backtracking. The experience balanced transactional speed with system reliability, helping users move from intent to bind with greater confidence.
🌟 Quote completion clarity ↑ 34%
⏱ Time-to-bind ↓ 29%
📉 Invalid submission errors ↓ 41%
📈 User continuation across quote stages ↑ 26%
© 2026 Stanford Ashcraft. Portfolio work shown for illustrative purposes.
Integrated Quote
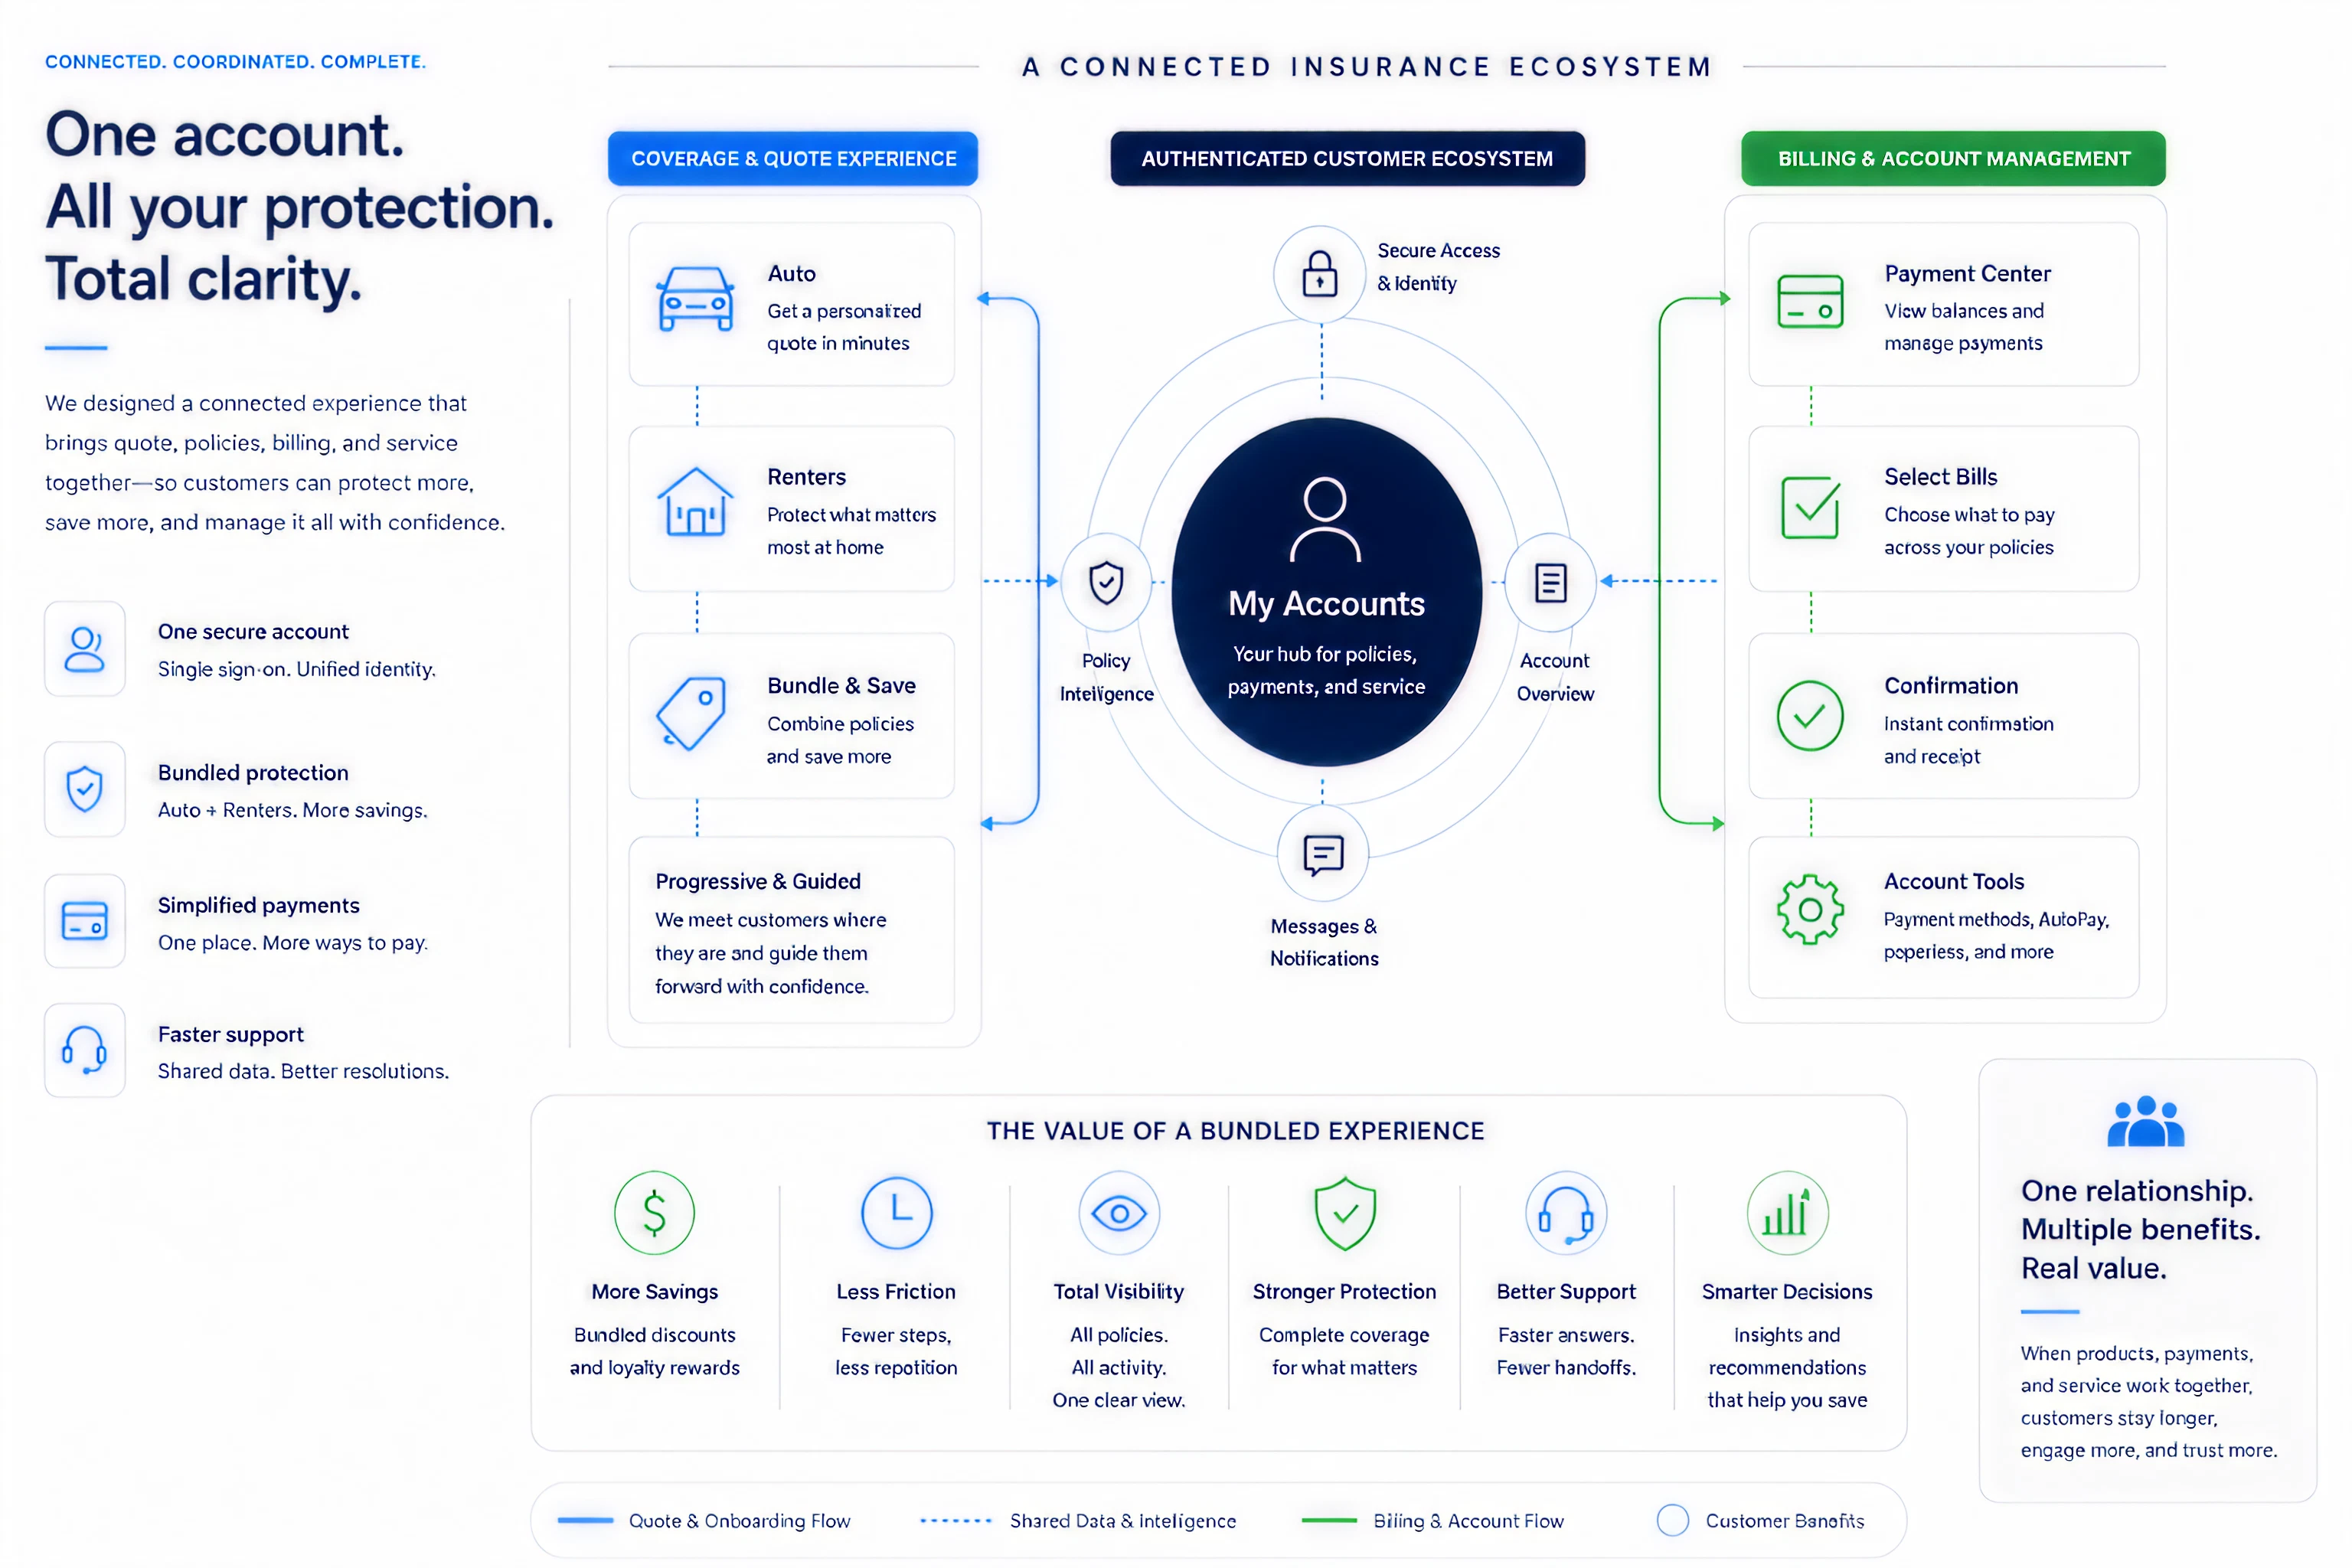
A billion-dollar decision flow built for clarity, trust, and speed
Insurance quoting is not simply a form experience—it is a multi-step transaction system shaped by eligibility, identity, pricing, and regulatory constraints. The challenge was reducing abandonment without oversimplifying the underlying logic. By restructuring the flow around progressive decisions and earlier pricing clarity, the experience became faster, more understandable, and more resilient under real-world use.
High-frequency payment workflows redesigned for faster comprehension, clearer hierarchy, and reduced transactional friction.
System-Level Decision Design
Translating complexity into coordinated execution
The work required aligning UX, business rules, engineering dependencies, and operational constraints across multiple teams. I helped shape the flow architecture around identity resolution, eligibility validation, pricing updates, and bind readiness—ensuring the system responded consistently as user inputs changed. The focus was not only interface clarity, but reducing downstream operational risk through better validation and guided interaction.
The quote flow behaved as a live system—resolving risk, pricing, and validation dynamically as users progressed.
Payment Center
Reducing operational friction in a high-frequency workflow
The Payment Center served as one of the highest-traffic authenticated experiences in the platform. Users needed immediate visibility into balances, policies, due dates, and available actions without navigating unnecessary complexity. The redesign prioritized glanceable hierarchy, faster comprehension, and clearer transactional pathways across responsive breakpoints. Validation, account context, and payment actions were surfaced progressively to reduce backtracking and improve confidence before submission. The experience balanced enterprise-scale operational requirements with a simpler, more consumer-oriented interaction model.
High-frequency payment workflows redesigned for faster comprehension, clearer hierarchy, and reduced transactional friction.
Select Bills
Clarifying multi-policy payment decisions across devices
Users managing multiple policies often struggled to understand which balances were due, how payments were grouped, and what actions were required next. The redesigned bill-selection flow simplified comparison and prioritization through structured grouping, progressive totals, and clearer status visibility. Responsive layouts ensured consistency across mobile, tablet, and desktop environments while maintaining transactional confidence. The flow emphasized transparency and decision clarity—helping users understand what they were paying, why it mattered, and how their selections impacted the final transaction before submission.
Structured bill selection reduced ambiguity and improved decision confidence before payment submission.
Confirmation
Confirmation & Resolution
Confirmation screens are often treated as endpoints, but in transactional systems they also function as reassurance, validation, and operational continuity. The redesigned confirmation experience clarified payment status, account updates, confirmation references, and next-best-actions immediately after submission. The system emphasized trust and resolution—ensuring users understood what had changed, what was completed successfully, and what actions remained available. This reduced uncertainty after payment while reinforcing consistency across the broader billing ecosystem.
Confirmation became more than a receipt—it reinforced trust, completion, and next-step clarity after transaction submission.
Metrics & Impact
Measured improvements across clarity, completion, and operational efficiency
Measured improvements across clarity, completion, and operational efficiency
The redesign improved how users progressed through quoting while reducing invalid submissions and unnecessary backtracking. The experience balanced transactional speed with system reliability, helping users move from intent to bind with greater confidence.
🌟 Quote completion clarity ↑ 34%
⏱ Time-to-bind ↓ 29%
📉 Invalid submission errors ↓ 41%
📈 User continuation across quote stages ↑ 26%
© 2026 Stanford Ashcraft. Portfolio work shown for illustrative purposes.